Against CR 20 monsters, having 3 additional points of AC results in almost 20 less damage (per monster per round). One additional point of AC shaves off about 3 damage against a CR 10, and two points of AC mitigates approximately 10 damage against a CR 16.
Well, not quite, but close. To be a straight line, you'd have to stop at CR 19, not CR 20, since it makes a jump of 18 points of damage from 19 to 20. Of course, you can also start at CR 1/2 instead of CR 1 if you want. Starting at CR 1, the increase in damage per CR from the previous CR is exactly 6 points, which like @Fanaelialae says is pretty obvious from the chart. Starting at CR 19, the increases are 18 points per CR.
Also, your chart is mislabeled: you plotted "damage per round", not "damage per CR".
Which wasn't the point of the thread since the OP is examining damage per CR. Now, if you want "damage per CR" (technically "maximum" damage...), you'd have something more like this:
Is this also taking into account if the DM uses the static damage number or if they are rolling for the damage roll for each and every attack done by a monster?
I'd be more inclined to look at a hit survivability calculation - CR DPR vs. character's average hit points at each level (factoring in character AC vs creature Attack bonus).
Here's a summary (might of missed something, so see further for details):
When considering "PC survival", given the calculated AC, listed attack bonus, calculated avg HP, and calulated avg dmg per round, it is difficult to quantify because there are so many considerations:
Firstly, this table does a direct comparison of equal PC level to CR for 1-20. Below CR 1, level 1 is used, and above CR 20, level 20 is used.
AVG PC AC and AVG HP by Level use equal class distrubtion probability by HD type. Since half the classes are d8, for example, those classes carry 50% weight. Constitution modifier to HP is likewise HD dependent, and has some increase over levels. Obviously, feats and racial considerations are not included. HP uses average listed by each class, not "rolled".
Calculated Damages per round include change of critical hits.
The "three important ranges" are:
Green: here the PC survivability is "100%" (for non-critical damage) since the maximum damage is less than the average HP. Obviously, there is a change PCs will have below average HP, and critical damage could result from the attack, so it isn't 100% in reality, but will most likely be the case.
Blue: this is the expected average percentage of PC HP remaining after a full round of attacks. In this range, the average is about 35%, meaning the PC will on average lose 65% of their HP in that round. This again includes the probability of hits (including criticals) against the stated ACs.
Red: 0%. Given the massive damage potential at this CR and the average HP of level 20 PCs, survival is basically 0%. Now, like the green region, it isn't actually 0% because there are is always the change of a high HP PC surviving, but given the average HP, isn't going to happen. Barbarians, particularly with their rage feature, have a very good chance of surviving in the red zone. So, except for outliers, most of the time survival is going to be 0%.
Personally, the blue zone is the most important to me. It indicate that against an equal CR creature, a party of 4 PCs who fail to stop the opponent in a single round, indicates a PC attacked again on a second round is most likely going down.
Here is the table for relevant calculations used above:
Is this also taking into account if the DM uses the static damage number or if they are rolling for the damage roll for each and every attack done by a monster?
Assuming the damage dice are based on the DPR value, they'll likely roughly average out to a similar amount. On any given attack you might roll more or less damage, but over a sufficient number of combats it'll trend toward the average.
Because I'm lazy and didn't want to have to redo T1, I went with the following AC: T1=17, T2 = 18, T3 = 19, and T4 = 20. The results were interesting. I'll try to write up the tables tonight, when I have time.
To summarize, T1 remains 3.38 damage / CR. Unless you treat CR 1 as part of the fractional tier (which I'm beginning to think ought to be the case, as CR 1 is an outlier), in which case CRs 2-4 average 3.1.
T2 is 3.18.
T3 is 3.24.
T4 is 3.5.
Depending on how you look at it, DMG/CR does still rise across the tiers but by only a miniscule amount.
If you include CR 1 in T1, then damage actually dips in T2 and T3, but pulls slightly ahead in T4.
Either way, I think this demonstrates just how potent even seemingly insignificant AC boosts are in 5e.
Well, not quite, but close. To be a straight line, you'd have to stop at CR 19, not CR 20, since it makes a jump of 18 points of damage from 19 to 20. Of course, you can also start at CR 1/2 instead of CR 1 if you want. Starting at CR 1, the increase in damage per CR from the previous CR is exactly 6 points, which like @Fanaelialae says is pretty obvious from the chart. Starting at CR 19, the increases are 18 points per CR.
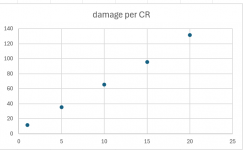
Also, your chart is mislabeled: you plotted "damage per round", not "damage per CR".
Which wasn't the point of the thread since the OP is examining damage per CR. Now, if you want "damage per CR" (technically "maximum" damage...), you'd have something more like this:
So - by damage per CR, I meant to illustrate the average damage (per round - of course it's per round, it's not going to be per hour...) in relationship to the CR. (again, I'm using the DMG numbers) You will note that between CR 1 and 20, the relationship is linear - it's not a curve, it's a straight line. The R2 of that line is 0.9985, which is quite good (although this is average damage, not the range, I didn't feel like getting into heavy stats).
The equation of the linear curve is: y = 6.2548x + 4.1014 , which is the classic "y = mx + b", where m is the value of the slope, and b the intercept.
This tells us that for each increase of CR, average damage goes up by 6.25 (the slope)
The intercept of 4.4 tells us that damage doesn't start at zero. CR 0 creatures actually have lower damage than this, but CR 1/4 and above do, and CR 1 is a bit higher than what the curve tells us. I think this is intentional. In 5e, because of bounded accuracy, low cr foes remain relevant for a bigger level spread, and I suppose boosting their damage a little also helps this remain true.
Been making higher challenge monsters, and was noticing I had to really tune up their offenses compared to the existing monsters I've seen to feel like I was designing a suitable threat. That made me wonder what sort of benchmarks are built into the existing monsters as far as DPR per CR. I know damage isn't the only thing to consider, but it is A thing, and this is interesting...
I took the monster chart from Forge of Foes - they use a DPR (damage per round) which is mostly the average of the damage ranges given in the 2014 DMG page 274. It's worth noting that these values assume a monster is roughly equally balanced between defensive and offensive capability (at least whatever that means in game's maths).
I divided DPR by CR, organized the monster CRs by tier, leaving off the CR 21+ monsters for now, and here's what I found...
Tl;dr Average Damage per CR at Tier 0 (CR 1/8 to 1/2) is 21 damage... then at Tier 1 (CR 1 to CR 4) it drastically drops to about 8 damage... at Tier 2 (CR 5 to CR 10) it drops further to about 7 damage... at Tier 3 (CR 11 to CR 16) it drops further to about 6 damage... and at Tier 4 (CR 17 to CR 10) it stays about 6 damage with a minuscule drop. I'll post maths in spoilers.
This was fascinating to me, as my expectation would be the trend should go in the opposite direction – i.e. increasing damage per CR for monsters intended to challenge high-level characters.