
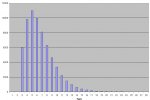
Because I'm a total dork, I ran these simulations and graphed them in Excel. The "with Save" chart is 10,000 20's rolled with around 27,000 deaths. Then, after re-reading the rules supplement and hearing nothing about a natural 20 saving, I decided to run 100,000 death trials with no saves (though Excel only gives us space for 64k, so I had to dump some of the results) The results are in the "no Save" graph, and it changes the math quite a bit.
I've got the .XLS file if anybody else wants it.
I've got the .XLS file if anybody else wants it.


")


