Judge decides case based on AI-hallucinated case law

The question that remains is, "do we still have unfilled jobs to fill?".
Generally yes, but not enough, that's why we create new jobs. Did the Doordash delivery person exist in 2010? Did the YouTuber exist before 2000? These things might be the most known inconsequential jobs, but there are so many others less known, but way more important. People also act as if other people can be only one thing, they can't learn new stuff, they shouldn't have to learn new stuff. And even if it's cutting edge stuff, it's young people from a new generation, they are now doing this new job and not an old one, thus making room for the workforce.

Now imagine that from an IT perspective, someone learned on Windows 3.11 and should not be forced to learn anything new... How much use would such an IT person be today if they didn't learn new things. You don't want to know the amount of pushback we got from IT personnel managing Windows Servers locally, when we started migrating folks to the cloud. The primary reason: we were taking their current jobs and forcing them to either learn something new or become obsolete. Many, many of those people could do that when push came to shove, some moved into managing those new cloud services, others moved to different branches of IT.

And it's not just IT people that need to keep learning new things, it's every profession. How many illustrators started learning digital tools? How many musicians? Even the manual labor jobs, folks needed to learn how to use a nailgun, new materials, new products, new rules, etc. Progress. And sure there are folks that can't keep up, that's why you need safety nets, so those folks don't fall flat on their face, but those people are a LOT less then people make them out to be.
I don't know precisely which events you are speaking of, so I won't try to address them. But, broadly and historically speaking, major job dislocation isn't just, "They find another job." Jobs that they are trained for go away, and don't exist. For many, if a next job exists, it is a lower-paying role. Job dislocation will cause many to spend their savings, so families lose generational wealth, or ability to retire. Folks lose their healthcare, their housing. Substance addiction rates among those impacted rise.
Let me start that I grew up and live in a different country/culture (Netherlands), so my perspective and experiences are different from yours. I'm 49 and when I say youth, think '80s. We have relatively very little generational wealth, as our wealth is taxed, and then also inheritance is VERY heavily taxed. On the flipside we have social safety nets and people don't loose their healthcare when they loose their job. There are also processes in place where people either get retrained internally at a company or if they can't find a job in their current field are retrained by state run programs.

Even then, we've imported workers from Morocco and Turkey in the '60s-'70s as our local populations wanted to work in less physical jobs. After the Wall fell, starting in the '90s we had pretty big influxes of Eastern European workers. Still unemployment now has not been so low since 1975... For the last 50 years we've created more jobs then our population growth was able to support (in the end).

Now, this is not representative of the rest of the world, but it's an indication how things can work. And it's not as if where I live is a backwater country that doesn't do progress. Most people can move along with the progress, the small percentage that can't, we have social safety nets for. And addiction rates are not just tied to folks loosing their jobs, way more have addiction issues while they have a job.
By no means am I saying that the world should not adopt technological change. I am saying that wonton adoption causes harm that we can mitigate if we actually approach things thoughtfully. You would see much less resistance to change if you actually offered those who will be impacted something to help them through that change, or you targeted the change to boost, rather than replace, the people impacted.
Thoughtfully according to whom? If we would grade it along the lowest common denominator, we would still be living in the stone age. I'm not saying, don't care about other people, but don't make it an excuse either. Looking specifically at the US, there were and are already far greater issues, even before the general availability of LLM and image generation, and no one cared enough to fix that... It's either the folks that are potentially financially impacted, those that can profit from speaking out (license fees) or folks that have no skin in the game at all and doesn't cost them anything to shout "Boo!" from the sidelines.

I don't drink alcohol, never have, never will. So for me it's easy to say: "Ban all alcohol!". I don't drive cars (it's just a safer world without me behind the wheel), so It's easy to say "Ban all personal vehicles!". Because I have no skin in the game, I'm not giving up anything, it doesn't cost me anything. So do the folks that don't use LLM and image generation, they don't use it in the first place so they can easily call for a ban.

I don't have anything against LLM or image generation, I use both. But I have issues with it's use and usefulness. ChatGPT pretty much gave LLM a public boost 3 years ago, but both LLM and image generation (and related technologies) were already available before then. Examples include 'AI' support tools, both for phones, chat and email. Certain companies moved far too fast on that technology and replaced people with software and that often turned into disasters, even if they were able to recover from that, they had trouble getting folks back for those jobs as people knew that if the technology improved they could be fired again like that. Even today Apple's 'AI' software still thinks I'm calling about an iPhone when I'm clearly saying "AirPods Max"...

The nature of LLM is that it doesn't know the answer, it just gives you word strings that you expect and statistically belong together. LLMs can be useful, as long as you 'know the answer', if it's just a system with no expert human oversight, it's going to cuase so many issues! An example of that is the hallucinated case law that none of the lawyers were expert enough to detect it or wise enough to double check. This is also why I currently don't use LLM for work (and image generation isn't generally not that useful in IT), I generally work on projects that are either edgecase, very new stuff or custom solutions for customers. Add to that that many customers haven't gotten approval from both their security and legal departments for using specific LLM solutions (eventhough many folks still use LLM despite those limitations). The problem imho isn't LLM or image generation, it's the people not using it properly, and in my experience this is most of them. It's interesting, it has potential, but so do nuclear reactors and I don't see everyone building reactors in their basement and backyard... ;)
 

log in or register to remove this ad

When we replaced our hunters-gatherer with peasants, it freed manpower to occupy jobs as shaman and soothsayers that we needed greatly. When we had enough of them and they invented a lot of new technology with their free time, we had a hard time turning enough peasants into craftsmen, until agricultural progress (and demographic increase) allowed for more peasants to turn into workers.
Well ... not quite. The transition from hunters-gatherer to farmer meant that land became valuable, so the optimal strategy for a culture was to use the excess people not needed for food creation as a means to own more food-producing land. The first big revolution was not from hunter-gatherers to experts and technicians, it was to warriors.

The big early tech was then focused around how to more efficiently kill people and take their land.
 

Thing is, those individual situations are not showing at a more macro level, so for every family that lived worse due to the change, another family lived much better than before, so it is more than compensating overall.

During my lifetime, no, it has not. Real wages have remained basically flat for most of the American population since about 1979. That's not "more than compensating" - that's treading water.

Cite: Real Wage Trends, 1979-2019, Congressional Research Service.

It is of course of no comfort to the family that is living worse, but that's why societies, in general, have developped public policies to mitigate the widening of inqualities.

Discussion of public policy gets us into politics. So, I will limit myself to noting that "mitigating" inequality is patching over the fact that the inequalities exist, rather than correcting the actual inequality.

Focusing on average households, the same observation can be made: even excluding the top 10% of wages, the average, inflation-adjusted wage increased by 43,7% between 1979 and now in the US according to the economic policy institute.

The Congressional Budget office says otherwise. From 1979 to 2019, real (meaning inflation-adjusted) wages grew

41.3% for the 90th percentile, top earners
8.8% for the 50th percentile
6.5% for the 10th percentile.

That bottom is so low that, for some groups (for example - men) real wages have fallen by 3% for the 50th percentile, and dropped 7.7% for the 10th percentile.

It doesn't mean nobody in Detroit suffered, it means that on average, workers got wealthier

Again, not really true, as above - the person in the middle or below isn't having an easier time putting bread on the table, getting kids educated, or buying a home. Especially when you realize that wages do not equal wealth - increased wages in that top 10% may be getting eaten by other costs - like education debt - leaving them with less actual wealth increase overall than wages might imply.

so any observation of a single family being negatively affected is more than compensated, overall, by another family getting richer at the same time (ie, for one affected family in Detroit, there is a family that is living much better in the Silicon Valley).

Even if it were a simple one-for-one trade, that would be just shuffling around who gets to be poor from one decade to the next. If that's all you are going to do with technological advancement, why bother advancing?

But, in reality, it isn't a one-for-one trade. We are not in some zero-sum game among the wage earners!

In 1979, the US population was about 219 million, and the GDP was about $2.6 trillion dollars.
In 2023, the US population was about 343 million, and the GDP was abotu $27 trillion dollars.

Population increased by about 56%. Real wages increased about 6-8% for the bulk of them. But the overall wealth produced each year increased by a factor of 10.

That wealth is going somewhere - but it isn't to the wage earners who are technically producing that wealth - or real wages could have risen far more than 6% to 8%. It is getting siphoned out of the wage system entirely.
 

The law is a bachelor.

The law is a dagger that is gripped by the blade.

In practice, the law favors class, wealth, privilege and other factors besides. Without those, you're down to pure luck or a sympathetic judge, and hopefully some nice people in the jury box to gamble with your fate when you show up at the casino in your suit and tie, hoping that you look sincere.


During my lifetime, no, it has not. Real wages have remained basically flat for most of the American population since about 1979. That's not "more than compensating" - that's treading water.

You didn't understand what I meant by compensating. Most got a slight increase, and the large increase for the happy few is bigger than the loss experienced by those who lost.

Even the bottom 10th percentile rose by 6.5% (inflation-adjusted). So even the poorest household had an increase, even if it is small (though I wouldn't sneer at a 10% increase in wage myself). The only group who actually lost were the one you mention later (the bottom group of men falling by 7.7%, yet it was more than compensated: both the average increased and the median increased (so other got a larger increase than the decrease the losing group experienced). It didn't hugely compensate, but it didn't lead to a reduction overall, so it was more than compensated.

What's striking is the comparison with the 41.6% of the top 10 percentile. They got a large share of the "more than compensation", and that's when redistributive policies should or should not apply -- which isn't the topic of this board. I'll restrain myself to point out that there is a demographic target group that benefited greatly and have the means to contribute to wealth transfers, in case one think those are useful.

The figures you quote just illustrate what I wrote earlier: it's not the technical progress that made people poorer. On average, people are earning more. Detroit (low income male) workers earns less, but Silicon valley (high earning males) earns much more, and the lack of transfers makes make the first target group poorer.

The Congressional Budget office says otherwise. From 1979 to 2019, real (meaning inflation-adjusted) wages grew

41.3% for the 90th percentile, top earners
8.8% for the 50th percentile
6.5% for the 10th percentile.

Duh, they don't say otherwise. They mention a different metric. I was speaking of average wage, you quote hourly wage for the median, top 10th and bottom 10th percentile. Average wage can increase while hourly median wage decrease if people work more (more people doing full-time jobs over the period) and, more importantly, if the top wages increase significantly quicker. The top 10 percent increased by 41.3% and the top 1% by 138%. Both measurements are enough to drive the average up above the median value.

Whether it is more useful to look at the mean or median value for the discussion at hand is open to discussion (and the aggregate wage value would be the most interesting), but you can't state that they say otherwise when they say that a different measurement shows a different value.

Also, even discounting women, in the document we quote, the 10th percentile of men dropped by 7.7%, the median by 3%. Assuming we can extrapolate, the bottom 10th to 40th lost roughly 3 to 8% in wage, while the top half was between -3% and +41.9%. The top third to half of the population got large wage increase and bottom half the population suffered a limited drop. It is illustrating exactly what I wrote before.

Agreggate wages:

1762904738598.png


Adjusting for inflation, the aggregate wages went up by 129.7%. The population increased by 52%, so the wage shared by the population increased by 85%. Nothing contrary to the figures you quote -- which is expected, since I guess both the Federal Reserve and the CBO get their data from the same primary sources.

To caricature, even if everyone earns the same and just Elon Musk is paid tens of billions more, it is still better overall. Whether Elon Musk gets to keep his billions or has to share them with his fellow workers is political.


Discussion of public policy gets us into politics. So, I will limit myself to noting that "mitigating" inequality is patching over the fact that the inequalities exist, rather than correcting the actual inequality.

Mmmm, correcting the inequalities how, except by transfering wealth? I mean, I don't think you mean suppressing inequalities (ie, everyone has the same income level), and I don't want to delve into politics more, but could you explain what you mean by "correcting inequalities" if it's not ensuring everyone gets access to necessary services (food, housing, basic income, healthcare, education, pensions...) at an acceptable level through redistribution?


That bottom is so low that, for some groups (for example - men) real wages have fallen by 3% for the 50th percentile, and dropped 7.7% for the 10th percentile.

That's interesting, in the US the average was more than driven by the increase in richest household (and increased participation of women in the workforce (50.9% in 1978, 57.5% now) than elsewhere. If anything, the contrast between the increase by 28.8% of women's wage compared to men's is lending credence, in their minds, to the claim of incels. The catching-up while they stagnate can be felt as a decrease, despite men still being paid better.

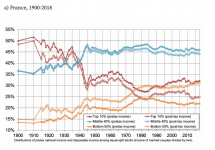
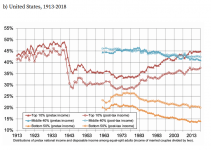
Here is the relevant graphic for France:

1762897870495.png


Where the revenue after social tranfer, in real terms, meaning inflation-adjusted, nearly doubled for the lowest 10% (blue dotted line), while it increased less for the top 10% (yellow dotted line) -- partly due to increased social transfers but largely due to increase of the minimum legal wage.

For the UK, here are some relevant data from the ONS:

1762899599033.png


Though it doesn't go back as far as 1975, it is showing a steeper increase than in the US.

For the Netherlands:

1762900225946.png


Both the median male and female wage increased, though women increased more. (In case anyone wonders, the overall median decreased because more women participate in the labour force and they still get paid less than men, so their increased workforce participation drives down the median value).

Again, not really true, as above - the person in the middle or below isn't having an easier time putting bread on the table, getting kids educated, or buying a home. Especially when you realize that wages do not equal wealth - increased wages in that top 10% may be getting eaten by other costs - like education debt - leaving them with less actual wealth increase overall than wages might imply.

Well, if the average wage increased, you can't say that it's not true that workers got wealthier on average. The person in the middle is the median, and while it might get less money than the average household (since income average can be pushed up by very high wages, while one can't have negative wage), that person in the middle is still getting paid more by 8.8% in real terms according to the data you quote.

Even if it were a simple one-for-one trade, that would be just shuffling around who gets to be poor from one decade to the next. If that's all you are going to do with technological advancement, why bother advancing?

Well, that's the "why should we bother researching a costly cure if most won't be able to buy it?". You can consider that situation was objectively better in 1979, and that would mean that men might be paid 3% more than now and women would be paid 30% less: if anything, that warrants having advanced? Even if it was just "everyone loses 1% except a few who greatly increase their wealth", it would still be worth it if it was a net increase overall. You just need to ensure after that that redistribution works for this outcome to be acceptable. A huge increase overall and no redistribution is something we experienced in the 19th century. It ended with bloodshed, and the starting of the trend of inequality reduction we enjoyed over the 20th century.

But, in reality, it isn't a one-for-one trade. We are not in some zero-sum game among the wage earners!

In 1979, the US population was about 219 million, and the GDP was about $2.6 trillion dollars.
In 2023, the US population was about 343 million, and the GDP was abotu $27 trillion dollars.

Population increased by about 56%. Real wages increased about 6-8% for the bulk of them. But the overall wealth produced each year increased by a factor of 10.

That wealth is going somewhere - but it isn't to the wage earners who are technically producing that wealth - or real wages could have risen far more than 6% to 8%. It is getting siphoned out of the wage system entirely.

Sure, I focused on wages because they are what affect the daily lives of most people and thus more reflecting the general feeling. A large share of the wealth increase go to capital owners (either collectively through saving plans or direct holding), but they tend to enrich the top percentiles and affect less the perception of most of the people (for whom capital gain are a relatively small part of their overall income). They do increase inequalities, though. But it is even more political to veer into whether the pie-sharing between capital and work should favour capital-owners or workers. Both solutions have proponents and opponents after all: without workers, there would be no wealth produced, but without the tools for them to work (capital) there would be no wealth created either. It is evident that if a larger share of the wealth created was demanded by workers (either individually, collectively (unions) or politically (legal minimum wages, wealth redistribution mechanisms...), their wage would have increased more (as they did in other countries).

Also, you should have used real GDP: the increased wealth increased by a factor of 4. Which is great enough!

1762899993202.png


Much like the US chose to have relatively small redistributive social policies compared to other OECD countries, the US is also one where the labour share decreased over time:

1762902343878.png


Nearly 8 points less compaed to 1979.

Contrast with the UK:

1762902464023.png

(OK, the graphic isn't easy to read, but the 1979 value is 63.1 and the 2025 Q1 value is 60.7, a much smaller decrease of nearly 5%).

And France:

1762902707865.png


(From 0.69 to 0.625, a decrease similar to the US's but with stronger redistributive measures in place and an uncanny increase in the early 70s followed by a sharp decline in the early 80s, so it can be felt as a stagnation of the labour share since 1990, while the US situation would have been felt as a stability from 1980 to 2000, followed by a continuous decrease -- which is certainly making the situation uncomfortable for workers depending on their wage for living, especially those who entered the workforce in the early 2000s).

Note that I don't focus on the actual labour share of GDP of these different countries, but rather at their trend, because it is what can be felt by people. A higher level of capital share, entrenched for a long time, may be socially accepted (like the labour share in the UK being historically lower doesn't translate into a structural feeling of inequality among English workers).


Edit: removed for clarity.
 

Attachments

  • 1762942641035.png
    1762942641035.png
    524.2 KB · Views: 13
  • 1762942678463.png
    1762942678463.png
    496.1 KB · Views: 14
Last edited:

Well ... not quite. The transition from hunters-gatherer to farmer meant that land became valuable, so the optimal strategy for a culture was to use the excess people not needed for food creation as a means to own more food-producing land. The first big revolution was not from hunter-gatherers to experts and technicians, it was to warriors.

The big early tech was then focused around how to more efficiently kill people and take their land.

I was illustrating job transitions into already identified, unfilled jobs. As you mention, the emergence of a ruling class and a warrior class was a new development (to own food producing land that it was until then useless to hold on). It was an illustration of creating new jobs out of the new economical situation. Sadly, it might happen again.
 
Last edited:

You didn't understand what I meant by compensating. Most got a slight increase, and the large increase for the happy few is bigger than the loss experienced by those who lost ...
@Jfdlsjfd -- as a data professional with several decades of experience in this area, here are some suggestions on how to make your arguments more helpful. The large wall of info you produced above will be -- and I'd argue should be -- ignored by most people. Here are some ways to make it more useful:

Use a small set of measures as your main metrics. Use the same aggregation in every chart and statistic unless there is a compelling reason to do otherwise
  • For this discussion, your metric should be wages / CPI. (Inflation adjusted wages).
  • You aggregation function must be the median. This data is highly skewed, so means are at best unhelpful and at worst deliberately misleading.
  • Please for the love of everything don't say "the median and the average" -- it makes it look like you think the only average is the mean. Instead say "both averages, the mean and the median,"
Cite every chart and table
  • For this data, all the US data should come form the BLS or entities using BLS data.
  • For other countries, use their official stats office or entities using that data.
----------
Most of your charts are about income, which is irrelevant to this discussion (if you want to make it relevant, be prepared for a lot of work to define what income is in a meaningful way. Ignoring investment income is a classic way for people to say "see, rich people actually do pay fair taxes", for example). Your data is mostly uncited, so I cannot trust it. And you switch between means and medians continuously (hint: charts showing "fractions of" or "shares of" are all about sums of data, which are relevant only to discussion of means, not medians).

A good way to organize your argument is to focus on a single set of data, show a key chart or table and then a few examples that add detail to your argument. That makes it more likely you'll have a productive discussion.
 

Use a small set of measures as your main metrics. Use the same aggregation in every chart and statistic unless there is a compelling reason to do otherwise
  • For this discussion, your metric should be wages / CPI. (Inflation adjusted wages).

Well, I added the part about income because Umbran specifically called out that wages don't reflect inequalities. They don't, of course, but that wasn't my point. My point was that technological increase did allow overall wage growth, and that in many countries we saw a reduction in wage inequalities over the 20th century, with a more recent stable/slow increase phase.


  • You aggregation function must be the median. This data is highly skewed, so means are at best unhelpful and at worst deliberately misleading.

I don't think the median is what should be observed in isolation. For the first part of my point, it doesn't matter if the median wage increased or decreased. A targeted increase in wages, concentrated among, say, the top quartile, can confirm an increase in wages even if the median wage stay unchanged. It's for the second part of the arguments (real wage increased over time) that the median is interesting. And the median real weekly earnings increased by 12% since 1980 : Employed full time: Median usual weekly real earnings: Wage and salary workers: 16 years and over (the St Louis Fed is saying they used BLS data). So no, most American employees aren't having a harder time to put bread on the table than in 1979.


  • Please for the love of everything don't say "the median and the average" -- it makes it look like you think the only average is the mean. Instead say "both averages, the mean and the median,"

It's probably linked to translation into English.

Cite every chart and table
  • For this data, all the US data should come form the BLS or entities using BLS data.
  • For other countries, use their official stats office or entities using that data.

Of course. It obviously goes without saying, and that's why I didn't say it explicitely. I copy/pasted graphs mentionning the sources in the wall of text or on the charts. The St Louis Fed uses BLS data, and other charts come the UK ONS (office for national statistics) and INSEE (institut national de la statistique et des études économiques). I am not expecting people to think I falsified the data to win points on an Internet board (especially when just illustrating common knowledge), so showing the graphs (and their key) felt sufficent at the time, without linking to them. Though I should have noted them, if only for finding again the graph for the Netherlands and specifically data from the Centraal Bureau voor de Statistiek.

Most of your charts are about income, which is irrelevant to this discussion.

The graph number #1, #3 and #4 are about wages, not income. The only graph showing income was #2, and used to show that redistributive measure can have a significant effect. Ignoring this graph doesn't change the conclusion.

Graph #5 was about GDP, because I answered a quote about nominal GDP, which is less useful to the discussion than real GDP, and the next 3 graphs compare the labour share of national income, which is a measurement that's standardized across countries, allowing for easy comparability, showing the trend in increase of the share of wealth going to capital owner, a distinct argument I answered to, and unrelated to the first argument. That's why I used another measurement: because I was answering another claim (this time, mostly to concur).

The last two shares answered the part about mitigating inequalities through taxes, to adress specifically the fact that "most of the wealth goes elsewhere". It is, I agree, a reply to a tangential argument which I should have ignored. I edited them out.

I should probably have itemized the three distinct claims I addressed.
 
Last edited:


Remove ads

Top